Independent Logging Module
Overview of APO Architecture
APO encompasses three major observability data monitoring modules: Trace, Metrics, and Logs. Users can deploy all modules using the default configuration or refer to this article to independently deploy APO's log monitoring module.
- APO-server: The server-side of the APO system, including front-end and back-end components, databases, and collectors.
- APO-one-agent: The collection side of the APO system, responsible for gathering observability data from various programming languages and business environments and sending it to the server.
Introduction
This article will guide you on how to modularly deploy the log monitoring module based on APO's log monitoring functionality.
offers an out-of-the-box solution based on Clickhouse. APO-one-agent, in conjunction with APO-server, enables rapid deployment of a comprehensive logging system, supporting various business environments such as Kubernetes and traditional servers. It provides developers and operations teams with convenient and fast log querying capabilities. The use of Clickhouse's columnar database further reduces the operational costs of the logging system.
Comparison with Traditional Methods
Traditional Log Data Collection:
ELK has long been the mainstream product in the logging domain, but ElasticSearch comes with high costs, and query performance degrades as data volume increases.
Currently, using Clickhouse as a logging solution can save 50% of operational costs compared to ELK, but it has the following issues:
- Mainstream Vector+Clickhouse solutions are not out-of-the-box and require significant management and configuration efforts.
- Most solutions do not support approximate full-text search functionality (which is crucial).
- Query efficiency is low when using double arrays or Map table structures.
- ClickVisual is the closest to an out-of-the-box logging solution but still has the following problems:
- Strong dependency on Kafka, making the solution inflexible and unfriendly for some small and medium-sized users.
- Lack of Vector integration; the native Clickhouse Kafka engine can cause Clickhouse to run out of memory under high traffic (thanks to community expert 十四 for the feedback).
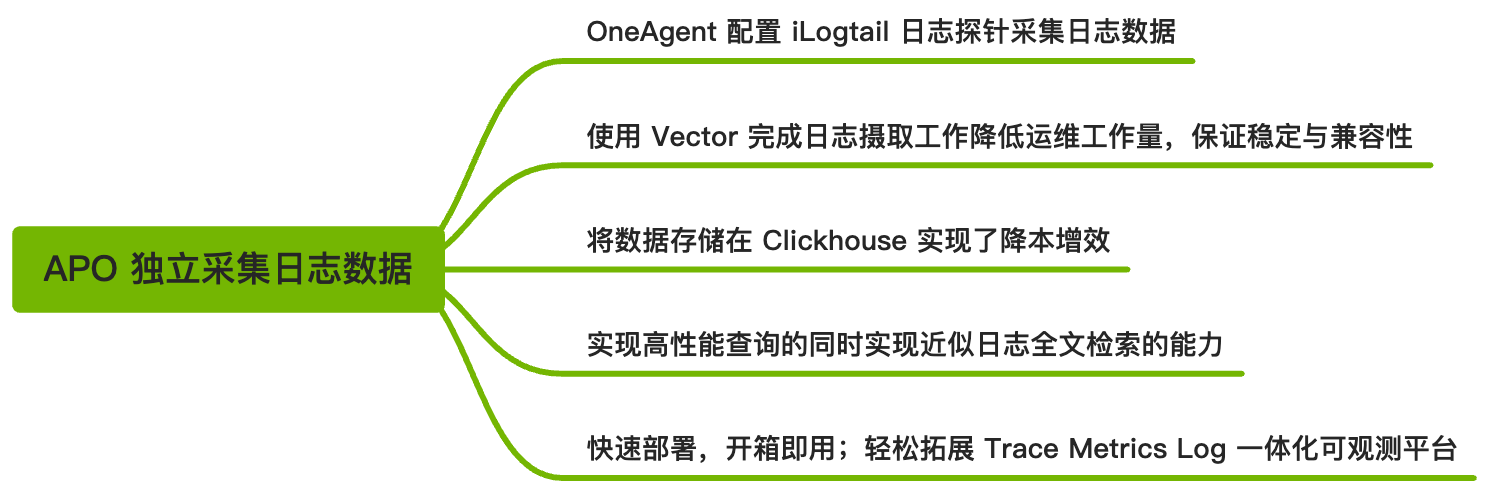
APO's Comprehensive Log Data Collection:
- Rapid deployment, out-of-the-box; easily expandable to a unified observability platform integrating Trace, Metrics, and Logs.
- Uses iLogtail to collect business logs from physical machines, virtual machines, Kubernetes, and other environments, ensuring lightweight and stable operation.
- Uses Vector, which requires almost no maintenance compared to Kafka, and allows parameter adjustments to ensure Clickhouse stability. Users can also integrate Kafka with Vector for further log processing.
- All queries are column-based on the actual log table, ensuring high query performance. Combined with additional storage of raw_log and skip indexes, it enables approximate full-text search functionality.
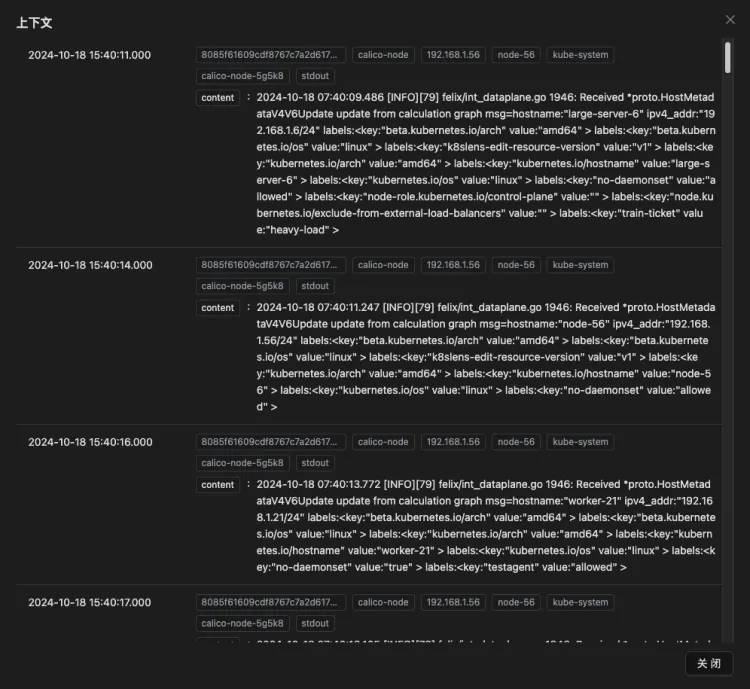
Support for Full-Text Search and Log Context Viewing
Full-text search functionality allows users to quickly locate specific information, while the ability to view log context provides a more comprehensive background of events. This is particularly important for troubleshooting and event analysis, enabling users to better understand the complexity of issues and quickly devise solutions, thereby improving system stability and reliability.

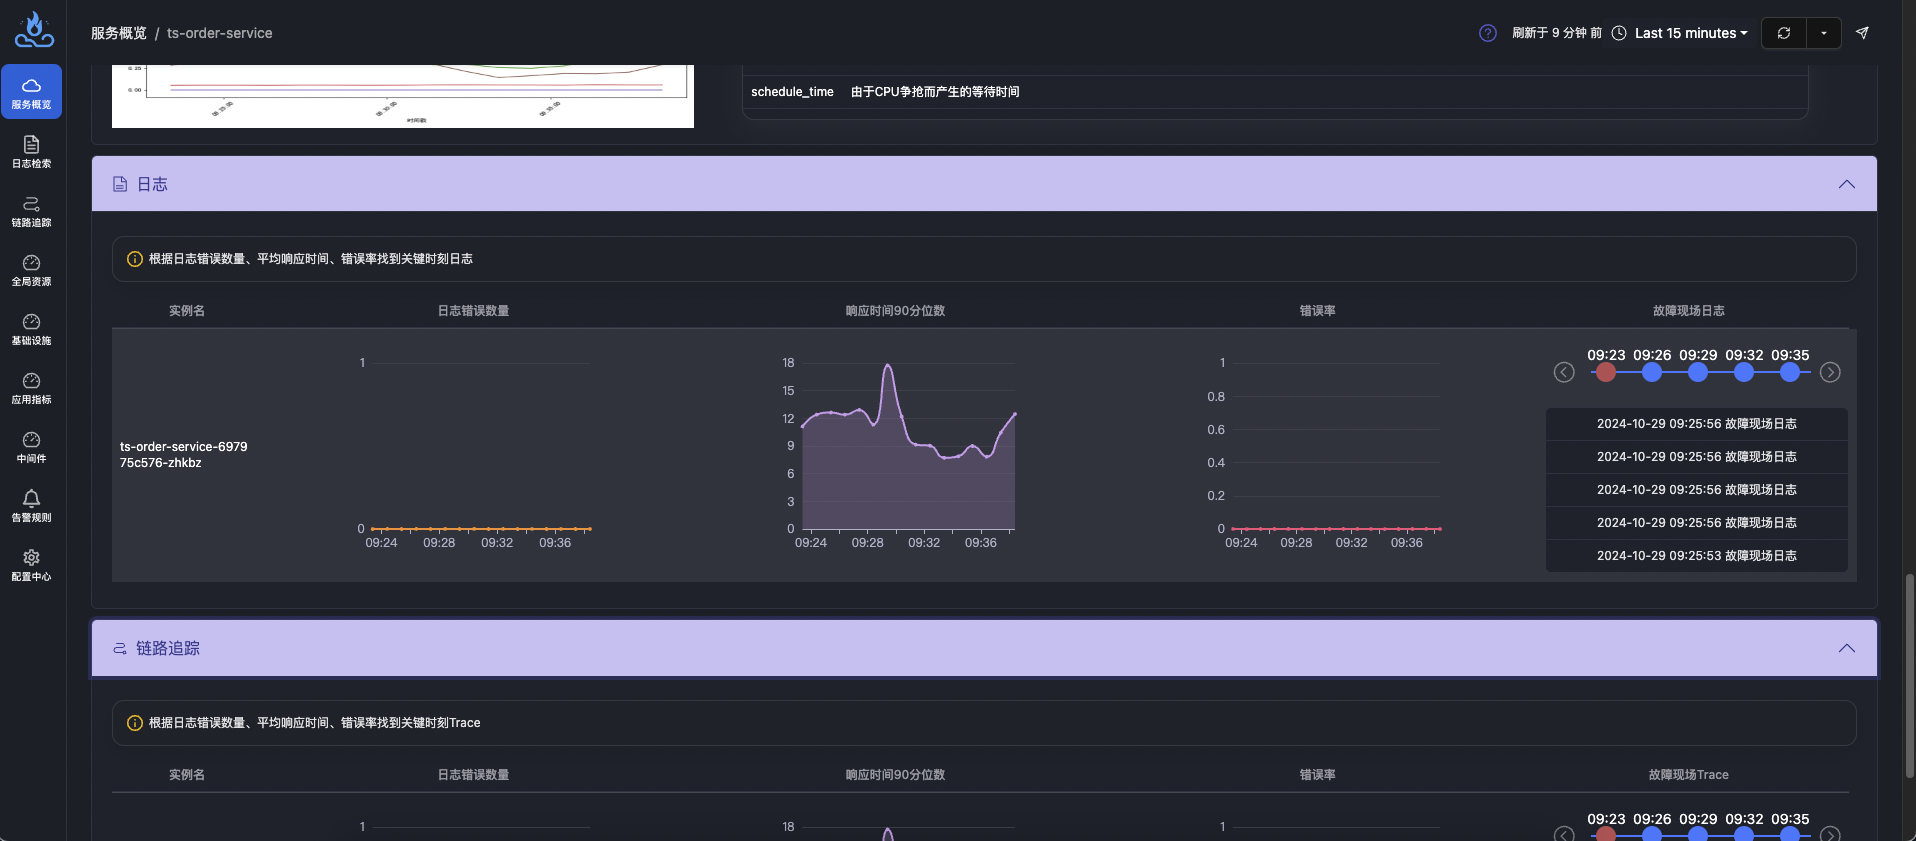
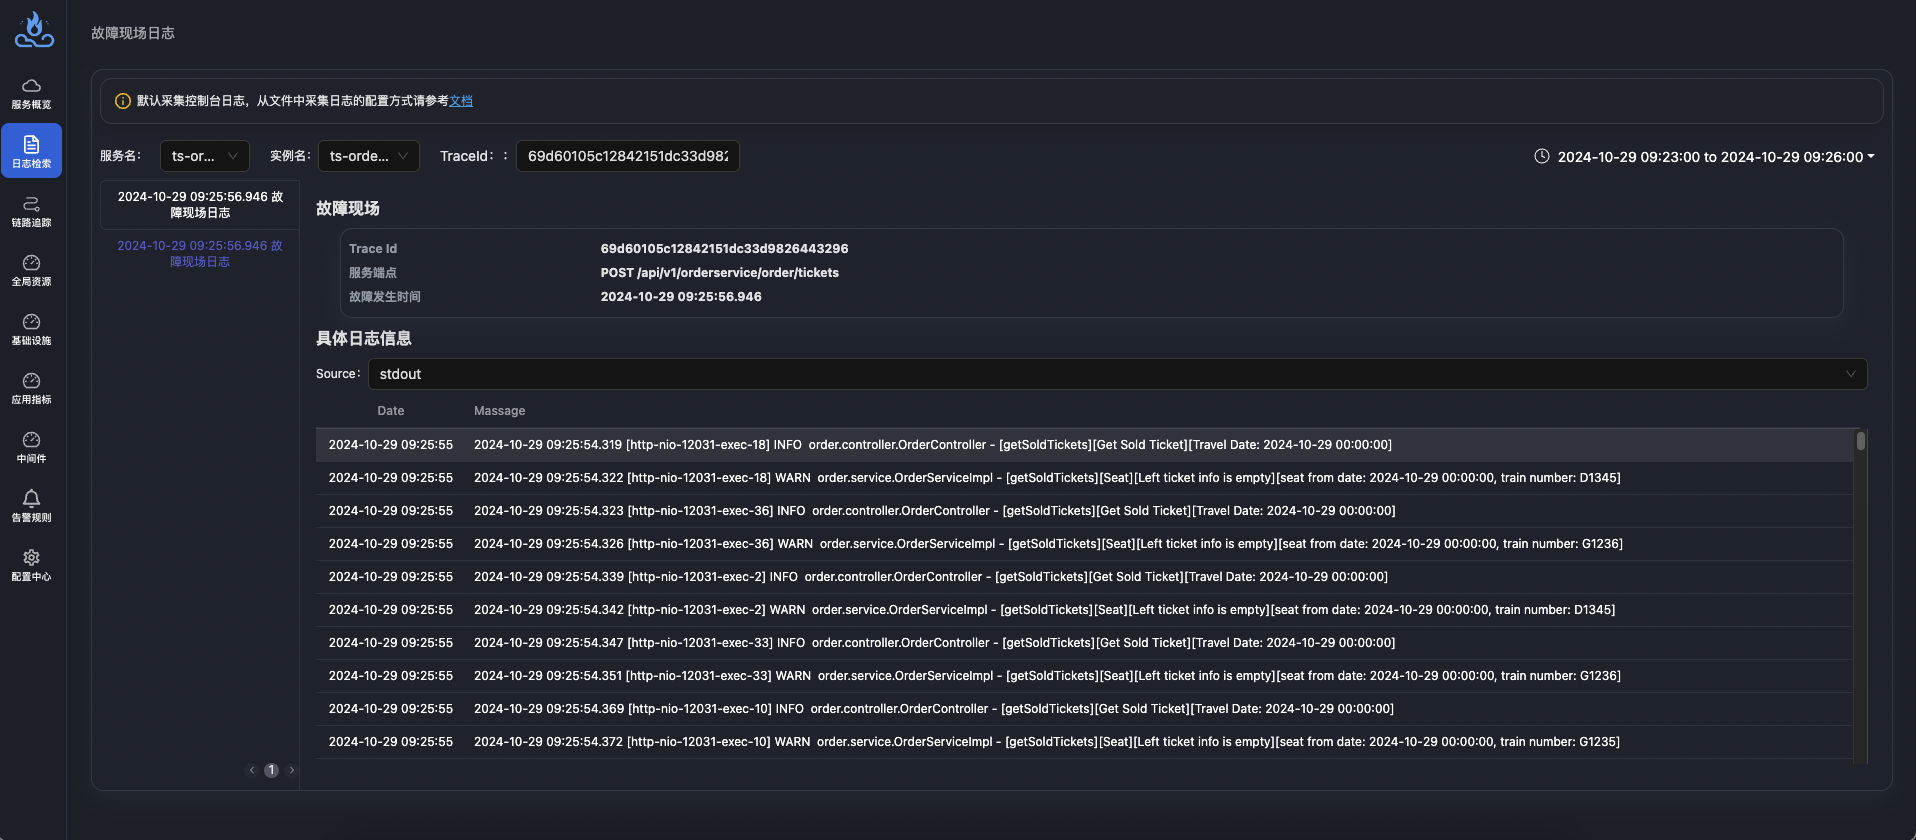
Easily Expand to a Unified Observability Platform Integrating Trace, Metrics, and Logs—Fault Information Correlation
Compared to traditional log monitoring systems, APO not only enables automatic collection, processing, and querying of full logs but also easily extends to a unified observability platform covering Trace, Metrics, and Logs. This platform allows different data types (such as metrics, traces, and logs) to correlate with each other, providing a complete observability view. This helps developers and operations teams be more efficient in performance tuning, troubleshooting, and anomaly monitoring. APO builds a full-stack observability system in a one-stop manner, greatly simplifying system management and monitoring tasks.
After complete data correlation in APO, users can select the corresponding time period in the log tab of the service details page to jump to and view fault log information.
How to Configure APO to Use Only the Log Monitoring Module
Step 1: Preparation
To install APO using Helm, ensure the following tasks have been completed:
- Install a Kubernetes server on your computer. For information on installing Kubernetes, refer to Installing Kubernetes.
- Install the latest stable version of Helm. For information on installing Helm, refer to Installing Helm.
- Network Policy: Ensure that the cluster/machine where APO-one-agent is located can access ports 30044, 31363, 31317, and 30319 of the APO-server cluster.
Step 2: Set Up the APO Helm Repository
To set up the APO Helm repository and download the correct APO Helm charts on your computer, follow these steps: Use the following command to add the apo Helm repository
helm repo add apo https://clouddetail.github.io/apo-helm-charts
helm repo update apo
Step 3: Configure APO to Use Only the Log Monitoring Module
Create a file named apo-values.yaml, define it according to your requirements, and mount the configuration during the deployment phase.
This step configures the APO-server data mode to use only the log module data mode.
# apo-values.yaml

# agentCollectorMode is the data collection mode
global:
  agentCollectorMode:
    - log

# APO-server
# Persistence configuration, default is false
# Production environment: Recommended to enable
# POC phase: Non-persistent configuration can be used for quick deployment
# If persistent configuration is enabled, create PV according to PVC
altinity-clickhouse-operator:
  clickhouse:
    persistence:
      enabled: true
victoria-metrics-single:
  server:
    persistentVolume:
      enabled: true
apo-backend:
  persistence:
    enabled: true
The configuration provided here is the basic setup for APO deployment. If you need to make more configuration changes, download the values.yaml file from the APO Helm Charts repository:
helm show values apo/apo > values.yaml
Step 4: Deploy APO-server
Run the following command to mount the configuration file and deploy.
helm install apo apo/apo -n apo --create-namespace \
-f apo-values.yaml
Step 5: Configure APO-one-agent to Use Only the Log Monitoring Module
Create a file named apo-one-agent-values.yaml, define it according to your requirements, and mount the configuration during the deployment phase.
This step configures the APO-one-agent data mode to use only the log module data mode.
# apo-one-agent-values.yaml

# apoServerIP is the ClusterIP where APO-server is located
# agentCollectorMode is the data collection mode
global:
  apoServerIP: x.x.x.x # FIXME
  agentCollectorMode:
    - log
The configuration provided here is the basic setup for APO deployment. If you need to make more configuration changes, download the values.yaml file from the APO Helm Charts repository:
helm show values apo/apo-one-agent > values.yaml
Step 6: Deploy APO-one-agent
Run the following command to mount the configuration file and deploy.
helm install apo-one-agent apo/apo-one-agent -n apo --create-namespace \
-f apo-one-agent-values.yaml
Step 7: Verification
Execute the following command to check the pod status:
kubectl get po -n apo
Uninstall APO-server
kubectl delete clickhouseinstallation apo -napo
helm uninstall apo -n apo
kubectl delete ns apo
Uninstall APO-one-agent
helm uninstall apo-one-agent -n apo
kubectl delete ns apo